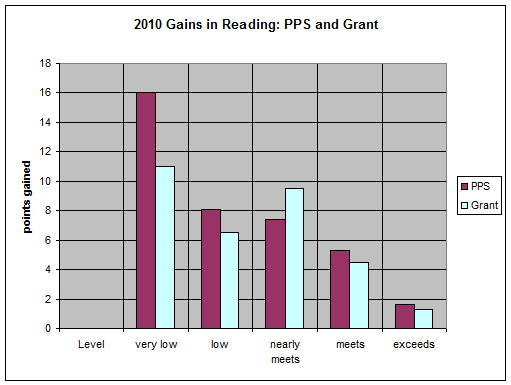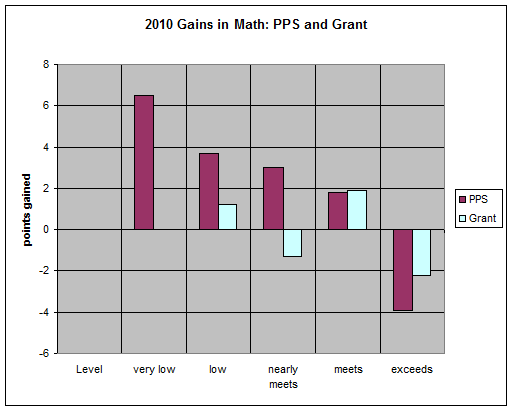
Student test score gains by ability, PPS compared to Grant
(the means of the previous test level are included)
This table and chart show the way using student gains by ability level can provide an easy-to- understand overview of the performance of an individual school. Grant is the largest High School in Portland. Its overall mean score is above the district average, but the gains of most ability groups of students were below average as was the mean gain.
The District mean score in reading was 240.8; Grant's was 244 . The District mean score in math was 238; Grant's was 241.7 . The higher absolute student scores conceal the fact that student growth in reading from 8th. to 11th. grade was lower for most groups at Grant than on average in PPS. The students who entered Grant were probably above the district average, but once they were there, they gained less on average in reading than their classmates in other Portland High Schools. The "probably" is because we don't have 9th. grade scores. The one exception was the group of students who "nearly met". These students did better at Grant.
The math story is more complicated: students who "met" and "exceeded" did better at Grant than in PPS; students who were below the "meets" cut-off did worse.
It's important to look at gains by ability level in part because higher-achieving students across the district make lower gains. Thus, the lower overall reading gains at Grant could have been due to the fact that the overall average at Grant is higher. Comparing the gains of each group with equally-able students across the district enables us to eliminate this as the most important reason for the lower gains at Grant.
Anther approach would be to create two graphs for the gains of each student against his/her ability level, one for the district and the other for the school and to measure the "effect size"--the shift right or left of the school's curve against the district's curve. The district might be able to do this but I can't.
To reach a solid conclusion, however, a moving average for several years should be created.
|
|
||||||||||||||||||||||||||||||||||||||||||||||||||||||||||||||||||||||||||||||||||||||||||||||||||||||||||||||||||||||||||||||

